
Over the past 30 years, the Center for Community Research and Engagement (CCRE) at UMass Lowell has developed expertise on approaches to building strength in communities and engagement in collaborative community problem-solving around pressing issues. Based on a shared vision and plan with community partners, the CCRE provides opportunities for scholars and students to learn and build knowledge, facilitate needed change, and take lessons learned to other communities.
Deeply engaged in issues affecting the well-being of people in the Greater Lowell area of Massachusetts
Ways to Collaborate

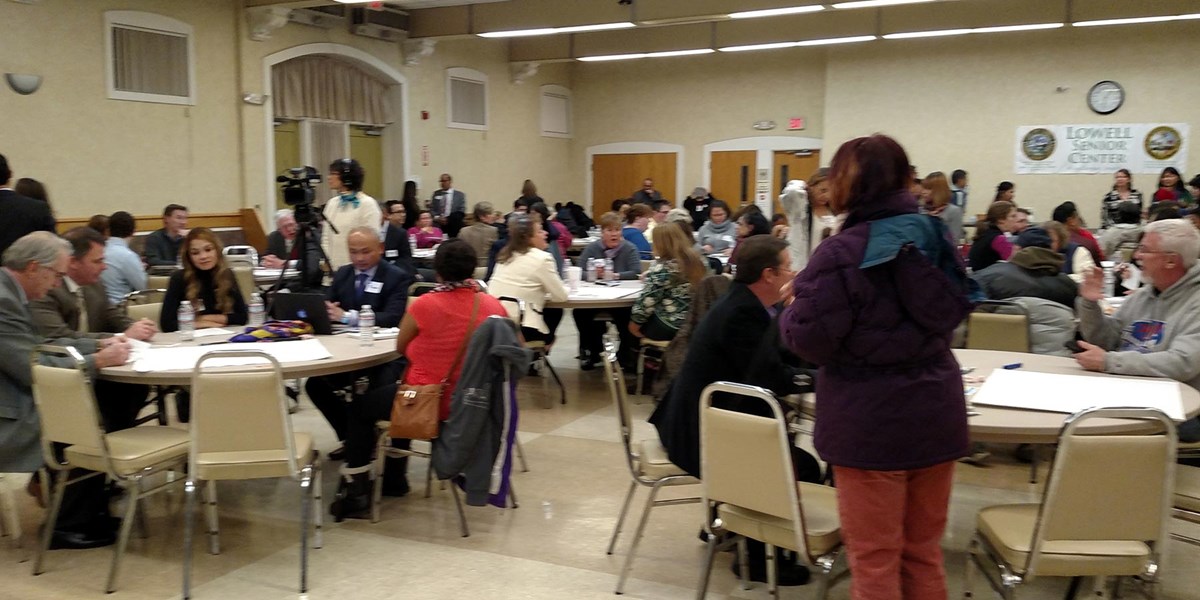
The 2025 Community-University Connections Breakfast.
Faculty and Staff
CCRE can help faculty and staff find the community connections you are seeking whether it be to incorporate community field work or service learning into your course, identify an appropriate practicum placement for students, or solidify a community-based research partner.
Working with the Lowell community to promote health and wellness.
Community Organizations
Community groups should reach out if you are seeking to collaborate with us or for help finding the expertise you are looking for at UMass Lowell. Even if you are not sure what you are looking for, we are happy to meet with you to brainstorm.

Students enjoy the ice cream social.
Students
We facilitate connections between community organizations, students, faculty, staff and departments. We have experience working with or linking students to internships, practicum, work study, service learning, and volunteer opportunities.